How do I use the Map View?
The map view can be used to visually see tasks on a map. Additionally, it can also be used as a secondary source of location information for personnel using the GPS on their mobile applications.
NOTE: Personnel location information from a mobile app should not be used as a primary source of location information for items such as safety. This is a secondary source of information that is great for overlaying location with tasks. However, for tier 1 safety items, it is recommended to use a dedicated hardware solution such as a truck GPS or the GPS off a Blackline H2S meter.
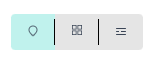
The map view is accessed by clicking the button shown below above the main workspace
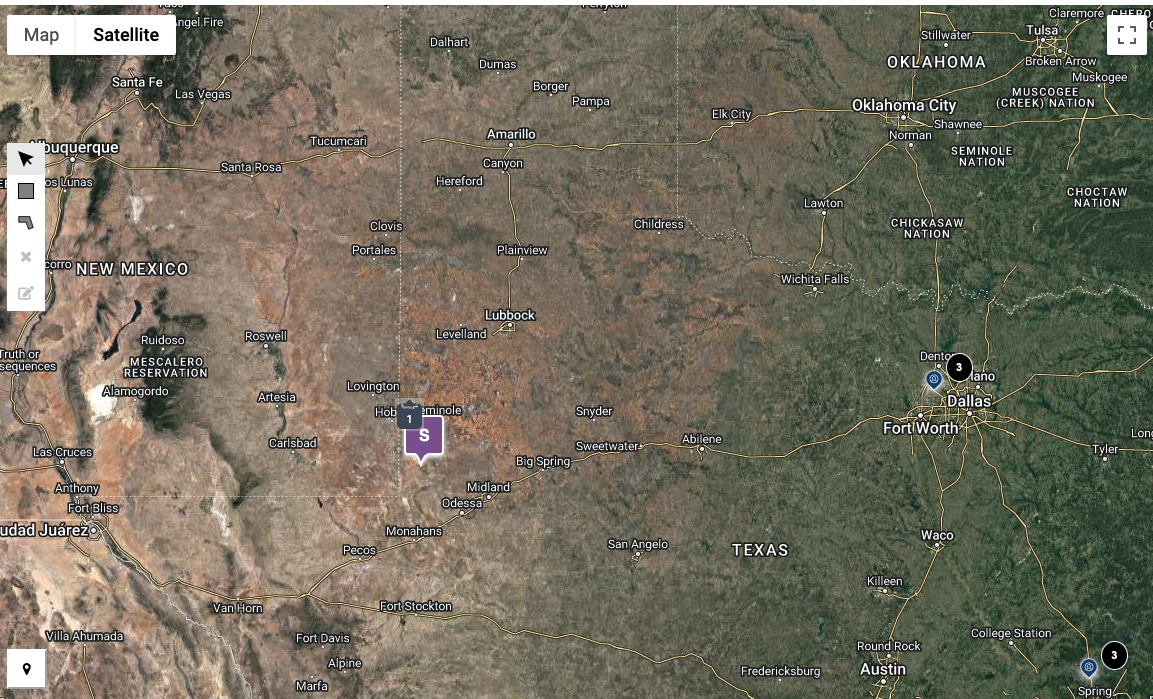
The map view can be viewed as a normal map view or as a satellite map view:
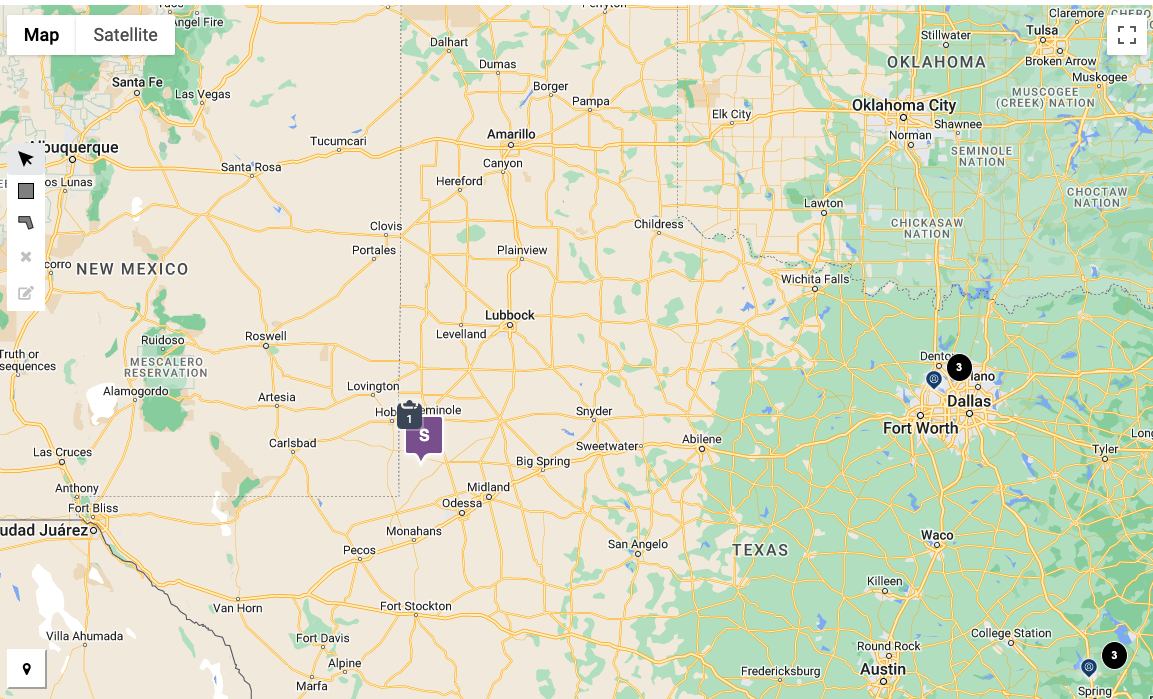
Here’s what all the different icons on the map mean:
# | Icon | Meaning |
|---|---|---|
1 |  | The purple square pindrop indicates a single geographic location or a collection of geographic locations that have tasks associated to them. If the map is zoomed in enough to identify a single location - it will show up with a clipboard as shown. If not it will show up with a circular black icon as shown in #4 indicating the number of geographic locations inside the clustered area that can be identified independently once zoomed in. You can click on this cluster and the map will automatically zoom in. |
2 |  | The clipboard with a # inside indicates the number of tasks at a specific geographic location. This clipboard icon will only show up as follows
|
3 | 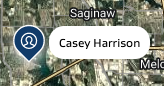 | The blue pindrop with the silhouette of a person indicates a single user or group of users. If the map is zoomed in enough to identify a single user - it will show up with the name of the user as shown. If not it will show up with a circular black icon as shown in #4 indicating the number of users inside the clustered area that can be identified independently once zoomed in. You can click on this cluster and the map will automatically zoom in. |
4 |  | This icon indicates a cluster of users or locations. Anytime you see this icon, you can click the purple square pindrop or blue user pindrop that it goes with and the map will zoom into the area. |
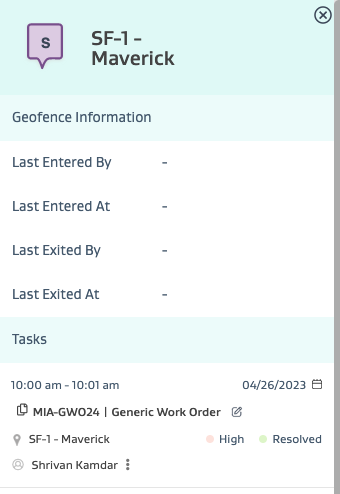
Clicking on a purple square pindrop with tasks will open up the location card as follows:
The task card shows the task details of any tasks at the location as well as the latest geofence information (if you have geodata/geofencing feature available) for the location.
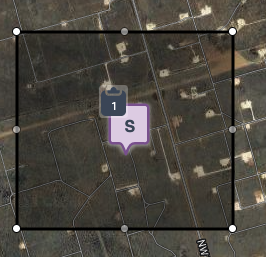
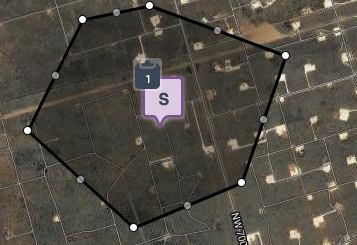
You can use the icons below to select a series of stops to do a bulk edit on them by drawing a square shape or a polygon around the stops.
To cancel the selection, you can click the “x” button.
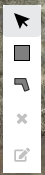
To perform the bulk edit, you can click the square with the pencil and start the bulk edit process. You can select a task type that exists within the area, and update the assignee and status. You can also review the selection of tasks in the bottom grid as you update the selection of the geographic shape and the task type.
