What functions are supported in calculated measures?
In Joyn O&G Analytics, an admin user has the capability to create custom calculated measures that can be used in grids and charts like base measures. All simple arithmetic calculations and few functions are supported in calculated measure creation.
Calculated measures should be grouped into measure groups. While creating the calculated measure, measure group should also be selected.
Conditions to group various calculated measures to same Measure Group :
Related measures of all the calculated measures added to the measure group should be same(common).
Calculated measures created by using Nday Average () and Carry Forward () functions cannot be grouped with other functions /calculations. These calculated measures should always be added to separate measure groups.
Functions
Function | Description | Syntax | Example | Notes |
|---|---|---|---|---|
DAILYAVERAGE - DAILY_AVG() 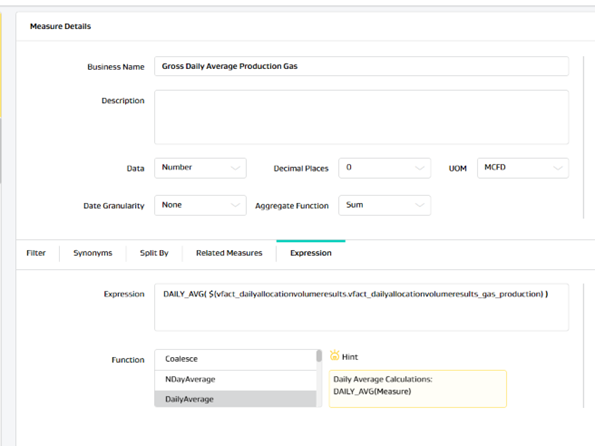 | To create a calculated measure that gives average of all values of a measure for the date range selected from left panel. | DAILY_AVG(<Measure>) | DAILY_AVG( $(vfact_dailyallocationvolumeresults.vfact_dailyallocationvolumeresults_gas_production) ) | If no date column is available on the grid, then average for each row will be calculated by considering the date range (no.of days from selected range)selected from left panel. But if a date column (of any granularity) is available in the grid, then daily average function |
NDAYAVERAGE - N_AVG 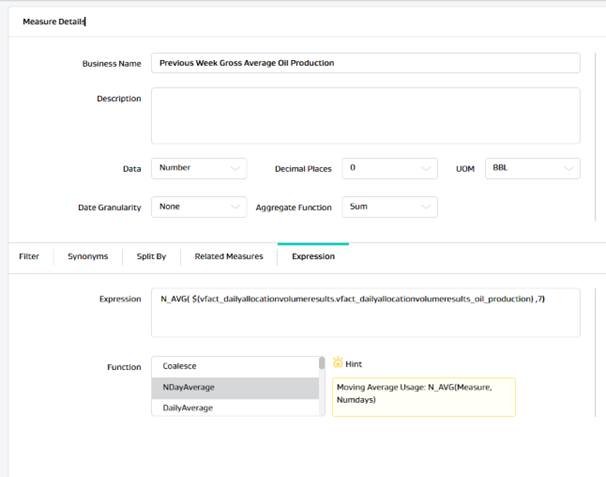 | To create a calculated measure that gives an average of last N days based on the inputs given on the function. | N_AVG(<Measure>, <End day>, <Start day>) Where Start day and End day accepts numeric values like 0,1,2 etc 0 -Today, 1- Yesterday, 2- Day before Yesterday and so on. | Get 7 days average starting from last day : N_AVG( $(vfact_dailyallocationvolumeresults.vfact_dailyallocationvolumeresults_oil_production) ,7,1) Get 7 days average starting from today : N_AVG( $(vfact_dailyallocationvolumeresults.vfact_dailyallocationvolumeresults_oil_production) ,6,0) Get Previous Week’s average: N_AVG( $(vfact_dailyallocationvolumeresults.vfact_dailyallocationvolumeresults_oil_production) ,13,7) | Nday Average gives expected result when date is present in the grid or chart. NDay Average measures cannot be grouped with other function/calculation measures. Measure group should only contain Nday average measures. |
COALESCE() | To create a measure which is a coalesce of two or more measures( i.e. get value from the following measure if the first measure returns null). | COALESCE<(Measure1>, <Measure2>, ..<MeasureN>) | COALESCE( $(vfact_dailyallocationvolumeresults.vfact_dailyallocationvolumeresults_oil_pipeline_sales) , $(vfact_monthlyallocationvolumeresults.vfact_monthlyallocationvolumeresults_oil_pipeline_sales) ) | |
CONST() | To create a calculated measure with a constant value | CONST(<BaseMeasure>,< constant>) | CONST( $(vfact_dailyallocationvolumeresults.vfact_dailyallocationvolumeresults_oil_production) , 10) | A base measure has to be used to create constant calculated measure. The created constant measure will only have entries (show values) for the days where base measure has value. other days constant will also be empty. All relations of base measure will also be applied to constant. Notes: As aggregate function is sum in the Constant query, we will see sum of rows based on the number of entries of the day same as for base measure.(For eg: if the base measure is on meter level and there are 4 entries for meter on a day, When user create a constant by using that base measure value as 10, he will see 40 as constant value for single day, if meter name is not used in the grid. |
MAX() | To create a calculated measure that gives maximum value of the given measure in the selected date range from left panel and on well level(entity level) | Max(<BaseMeasure>) | MAX( $(vfact_common_well_reading.vfact_common_well_reading_tubingpressure) ) | Max function will give correct result only on the lower level of data. i.e. on well level (Entity level). |
MIN() | To create a calculated measure that gives minimum value of the given measure in the selected date range from left panel and on well level(entity level) | Min(<BaseMeasure>) | MIN( $(vfact_common_well_reading.vfact_common_well_reading_tubingpressure) ) | MIN function will give correct result only on the lower level of data. i.e. on well level (Entity level). |
COUNT() | To create a calculated measure that gives count of values of the given measure that are greater than 0 in the selected date range from left panel and on well level(entity level) | Count(<BaseMeasure>) | COUNT( $(vfact_well_test.vfact_well_test_gas_injection) ) | Count() calculation will not include the records when value is zero. |
Carry Forward – CF() | This function can be used to identify the last known value of any measure for any given reading date, at object level. | CF(<BaseMeasure>) | CF( $(vfact_well_test.vfact_well_test_24_hour_oil) ) | Data from last 5 years can be carry forwarded till next 5 years User will be able to use carry forward calculated measure in Grids/Charts at date granularity for object level. |
Variance() | To find the difference between two measure values. Any base measure or calculated measures like Nday average /Daily average can be used within variance function. Variance = measure 1 - measure 2 | VARIANCE(Measure1, Measure2) | VARIANCE( $(vfact_dailyallocationvolumeresults.vfact_dailyallocationvolumeresults_oil_production) , $(Prev_Days_Average_6414d51f-7d61-4470-a8e8-18ab9b680106.calc_previousweekgrossaverageoilproduction) | Make sure that the aggregate function selected from Analytics config should be same for all the measures used in the variance calculation to get correct result 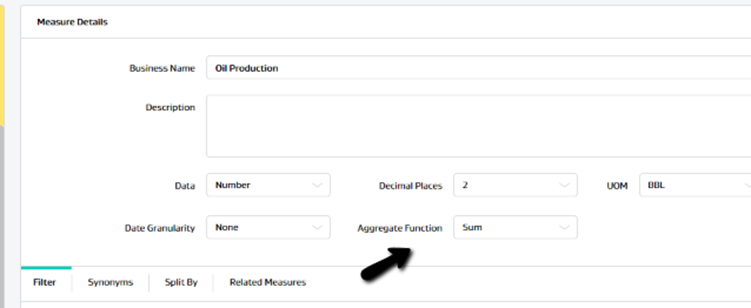 |
Variance Percentage - VP() | To find the difference between two measure values. Any base measure or calculated measures like Nday average /Daily average can be used within variance function. Variance Percentage = (measure 1 - measure 2)/measure2 *100 | VP(Measure1, Measure2) | VP( $(vfact_dailyallocationvolumeresults.vfact_dailyallocationvolumeresults_oil_production) , $(vfact_weekly_production.vfact_weekly_production_previous_week_gross_oil_production) ) | Make sure that the aggregate function selected from Analytics config should be same for all the measures used in the variance percentage calculation to get correct result. |
Month Till Date – MTD() | To create calculated measure that gives sum of the base measure value from starting of the month till the day for each date in the grid column. It is mandatory to use a Date (day level) in the grid to get result in MTD measure. | MTD (BaseMeasure) | MTD( $(vfact_dailyallocationvolumeresults.vfact_dailyallocationvolumeresults_oil_production) ) | MTD (Month Till Date) function will give correct result only if date column is present in the grid. |
Year Till Date – MTD() | To create calculated measure that gives sum of the base measure value from starting of the year till the day for each date in the grid column. It is mandatory to use a Date (day level) in the grid to get result in MTD measure. | YTD (BaseMeasure) | YTD( $(vfact_dailyallocationvolumeresults.vfact_dailyallocationvolumeresults_oil_production) ) | YTD (Year Till Date) function will give correct result only if date column is present in the grid. |
Production Loss – PL() | To create a calculated measure that calculates the production loss based on the input values. Expected Calculation of Production Loss= Measure1*(Measure2/24) | PL(Measure1, Measure2). | PL( $(vfact_weekly_production.vfact_weekly_production_previous_week_gross_oil_production) , $(Downtime_b825e0d5-6d57-44b9-b23b-46acbb5b65d0.calc_hoursdown) ) | Nday average calculated measures / Carry forward Calculated measures can also be used in PL() along with other base measures/simple calculated measures. |
Round Sum() | To create a calculated measure that calculates the sum of multiple input measures individually rounded. Expected Calculation of Round Sum = Round(Measure1)+ Round(Measure2)+..+Round(MeasureN) | ROUND_SUM(Measure1, Measure2, ..MeasureN) | ROUND_SUM( $(vfact_monthlyallocationvolumeresults.vfact_monthlyallocationvolumeresults_gas_sales) , $(vfact_monthlyallocationvolumeresults.vfact_monthlyallocationvolumeresults_gas_flare) , $(vfact_monthlyallocationvolumeresults.vfact_monthlyallocationvolumeresults_gas_use_on_lease) , $(vfact_monthlyallocationvolumeresults.vfact_monthlyallocationvolumeresults_gas_production) ) | Production Loss and Nday Avg Calculated measures are not supported in Roundsum(). |